2 Numbers and trends in organic production

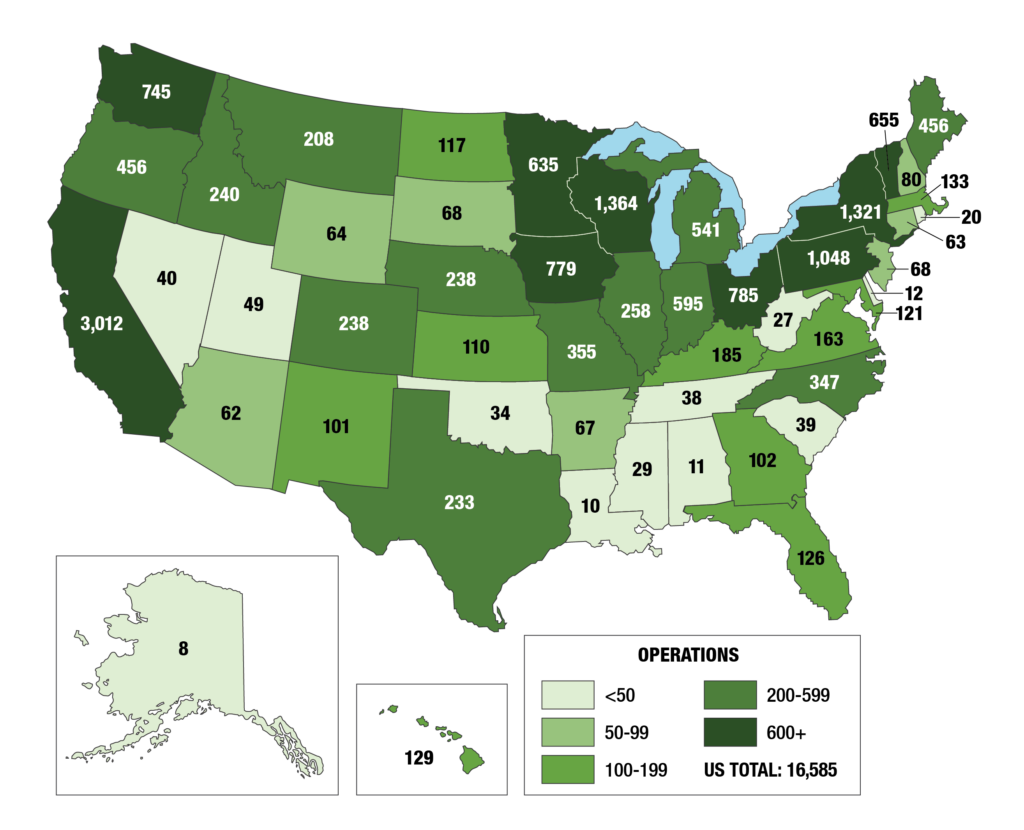
Data in Table 1 below are from the 2019 Certified Organic Survey conducted by . Since data gathering and reporting on organic agriculture began, there has been a steady increase in farms and acres under organic production.
| 2008 | 2014 | 2016 | 2019 | |
|---|---|---|---|---|
| Farms | 10,903 | 12,634 | 14,217 | 16,585 |
| Organic land (1,000 acres) | 4,004 | 3,643 | 5,019 | 5,495 |
| Cropland | 2,230 | N/A | 2,714 | 3,517 |
| Rangeland | N/A | N/A | 2,305 | 1,974 |
The data in Table 2. below, show that sales of certified organic production continued to increase from 2016. U.S. farms and ranches produced and sold $9.9 billion in certified organic commodities in 2019, up 31% from 2016. During the same year, the number of organic farms in the country increased 17% to 16,585, and the number of certified acres increased 9% to 5.5 million (Results include those certified organic and those transitioning to organic).
| 2016 (Millions) | 2019 (Millions) | % Increase | |
| Total sales | 7,554 | 9,926 | 31 |
| Crops | 4,193 | 5,787 | 38 |
| Livestock and poultry | 1,157 | 1,663 | 44 |
| Livestock and poultry products | 2,205 | 2,476 | 12 |
While the data above includes all organic commodities, not just animals and animal products, it highlights the strong and steady growth of the organic industry. If we look solely at livestock and livestock products, the growth has been equally strong. This, in large part, can be attributed to consumer demand and matches the trends seen in the previously discussed data.
| Organic commodity | Increase in sales from 2016 to 2019 | Total Sales 2019 |
| Eggs | 9% | 887 M |
| Milk | 14% | 1.6 B |
| Hogs and pigs | 17% | 8.1 M |
| Cattle | 26% | 293 M |
| Broiler chickens | 49% | 1.1 B |
| Turkeys | 67% | 139 M |
United States Department of Agriculture

